
Financial Analysis
| Finacial Year | Net Profit (after tax) | Gross NPA (Amount) | Gross NPA (%) | Net NPA (Amount) | Net NPA (%) | ROA % | ROE % | NIM |
|---|---|---|---|---|---|---|---|---|
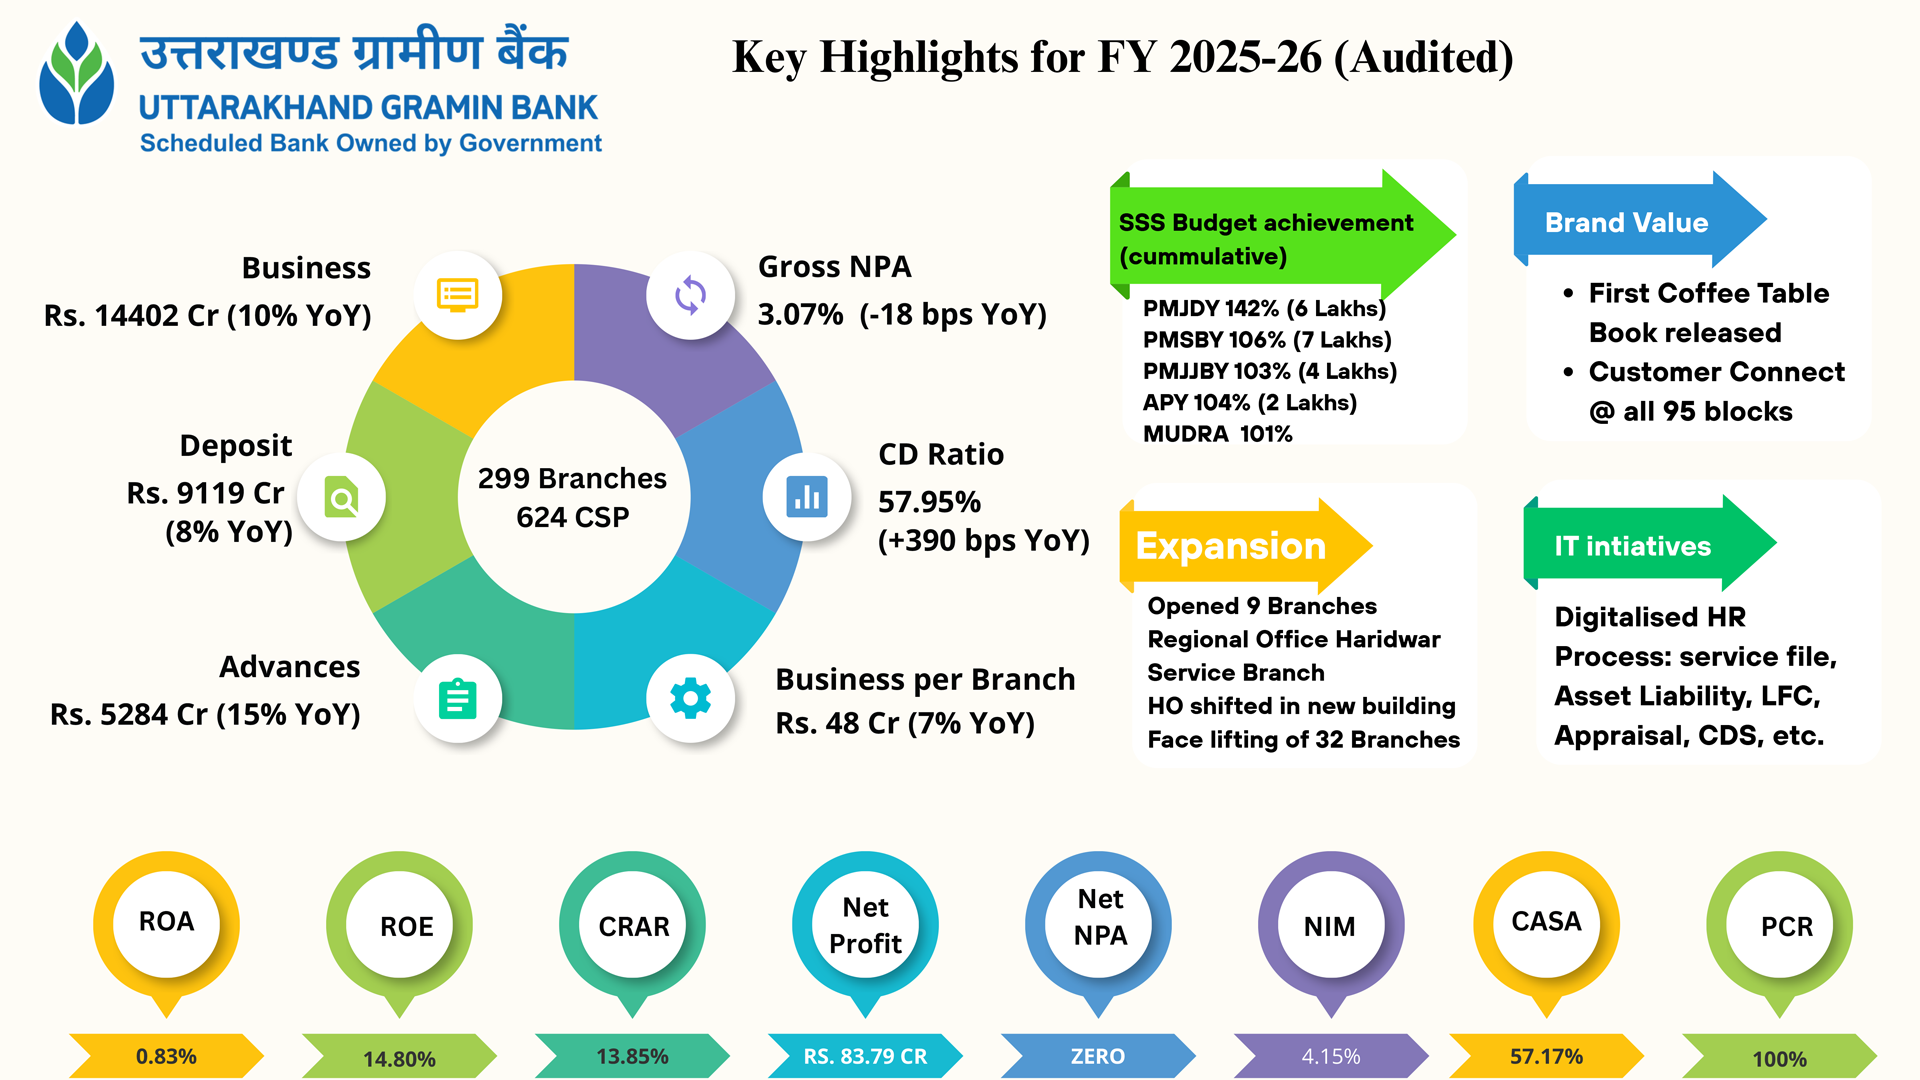
| 31.03.26 | 83.79 | 162.42 | 3.07% | 0.00 | 0.00% | 0.83% | 14.80% | 4.15% |
| 31.03.25 | 78.11 | 148.86 | 3.25% | 0.00 | 0.00% | 0.87% | 16.21% | 4.16% |
| 31.03.24 | 75.26 | 155.20 | 4.14% | 0.69 | 0.02% | 0.92% | 18.64% | 4.23 |
| FY | Deposits | CASA Deposits | CASA % | Advances | Total Business | CD Ratio | No. of branches | No. of staff |
|---|---|---|---|---|---|---|---|---|
| 31.03.26 | 9118.86 | 5213.05 | 57.17% | 5284.06 | 14402.92 | 57.95% | 299 | 1143 |
| 31.03.25 | 8470.50 | 4891.30 | 57.75% | 4577.95 | 13048.45 | 54.05% | 291 | 1025 |
| 31.03.24 | 7833.62 | 4563.96 | 58.26% | 3747.64 | 11581.26 | 47.84% | 290 | 999 |
| FY | Govt. Securities | Other securities | Mutual Fund | TDRs |
|---|---|---|---|---|
| 31.03.26 | 3825.00 | 44.06 | 59.30 | 854.61 |
| 31.03.25 | 3548.93 | 77.95 | 44.38 | 905.58 |
| 31.03.24 | 3620.51 | 77.91 | 23.99 | 857.96 |
- Annual Book 2024-25
Page 1 to 30
Page 31 to 60
Page 61 to 90
Page 91 to 136
May i help you?
